Monday, September 16, 2013

Past Sell-Off Dynamics

Beta during the sell-off for different swap tenors, fixing the dynamics of the 10y point as pure normal (BETA = 1) - for past selloff episodes in EUR and USD.


Different swap tenor reponse to a 1BP move in 10Y during these sell-offs (in BPS MOVE), as implied by the above BETAs.


Historically, the front end for USD has shown much lower beta (meaning more log-nomrality w.r.t. 10y rate) compared to Euro, perhaps due to a better pricing of fed expectation and less surprises in rate hikes (Notice how the Mid 08 oil shock was surprise for both the markets but for EUR was considerably stronger). In fact the strong and persistent correlation between front end slope for EUR we have now is only a recent phenomenon in the sell-off in 2013 (one of the major difference between the 2010 sell-off and the current sell-off). Whereas this has been common in USD in 2013 of course, and also during most of the past sell-off.

Projecting this in to future, the recent correlation of front end slopes with the belly (e.g. 1s3s vs 5y) will be stronger in USD than EUR, and I expect EUR to lead the first reversal of this correlation (provided we are not heading towards very different rates levels in EUR and USD) For directional trades this provides a good way to position for bearish (bullish) rates, by going long (short) the slope in USD vs EUR. Also for a contrarian trade, an OTM flattener in EUR vs USD in a good hedge for inflation suprises, (assuming ECB's reaction function is unchanged)

Friday, September 13, 2013

SABR Skew Dynamics & Beta | Part II

In original SABR model, the beta has two distinct roles - 1) it determines the back-bone of the atmvol vs atm and 2) it contributes to beta skew (and beta smile) in a way that is independent of the vanna smile (the smile driven by correlation parameter).

However, in most common implementations of SABR, this is NOT the case. The traders in rates are familiar in normal bps vols. So the ATM vols are input in terms of normal bps vols (as opposed to the ALPHA parameter, the ATM vol in correct beta).

Because of the implementation, the beta COMPLETELY looses its first role (the modeled back-bone). Instead of determining the the dynamics in terms of the back-bone, beta switches to play its role in determining the skew dynamics as mentioned in below mail - which will not be seen in a true implementation 

On the 2nd role as well, the implementation introduces a twist. The main point in implementation is, as opposed to parameterizing the model in terms of ALPHA (local vol in the correct blend), CORREL. VOLVOL and BETA, it parameterizes in terms of ATMVOL (vol in normal blend), CORREL, VOLVOL and BETA. in a generic model the interplay between beta skew and correl skew depends on two parameters - BETA and CORREL*LAMBDA - where LAMBDA is ratio of VOLVOL/ALPHA. So while the general rule is that a instead of decreasing the correlation (more negative) one can increase the beta to match a skew, this has impact on far OTM strikes.

As one increases the beta, the local-vol (at the correct blend) falls drastically, This drastically changes the LAMBDA ratio. This introduces a very different smile (curvature) effect at far OTM strikes This shows 1y10y smile for 1) correl =0, beta = 0.35 (blue) vs 2) correl=0.55, beta =1 (green). As can be seen the curvature on the far OTM sides is very different. We match the skew in 2nd case by setting beta =1 and increasing the correl. However this changes the local vol and the LAMBDA ratio. This introdcues difference in smiles in the far OTM strikes Typically, matching skews by changing beta or correl is NOT equivalent. One difference is obviously the change in the dynamics (which will impact hedges) mentioned in the previous post on this. The other difference, as illustrated above, a change in OTM smile

Friday, August 30, 2013

SABR Skew Dynamics and Beta | Part - I

Dealers in swaptions usually witness a particular skew dynamics - as the market sells off, the receiver skew richens and similarly a rally usually accompany a richening of the payer skew. So a plot of change in rcvr skew vs change in atmfs should look like an upward sloping line. The real life reason for this dynamics can tentatively be either from mean-reverting trade demands (buying payers on the rally etc) or due to sticky strike vols (large positions pinned around standard strikes).

The market standard model, SABR, successfully models this particular skew dynamics. This modeled change in skew in absence of change in other parameters is due to two parts - 1) the dvol/drate and 2)the SABR beta parameters. However, recently there is much stronger relationship between skew changes and ATMF (at the money forward rate) changes in the modeled dynamics than what is actually realized - especially for longer tenors and longer expiries - more so if we consider these are the points where dvol/drate is quite insignificant. 

This reflects a stronger-than-actual skew/rates dynamics modeled by SABR. A large part of SABR modeled skew dynamics is reversed on re-calibration to bring it back to the realized levels. This is especially true for longer expiries and longer tenor options.

SABR is an over-parameterized model and it is not possible to calibrate all the four underlying parameters from a snap-short of market prices. The usual practice is fix the beta parameter and calibrate the others. Which is not really an issue, esp if the model is treated as more like a good interpolater of vols, rather than a good model of the underlying dynamics itself, and remarked continuously. However, remarking continuously is usually not possible.

For delta-hedged market-makers this raises the issue of beta-induced market dynamics. The prediction of change in skew for a given change in rate, with other parameters remaining the same, is driven mostly by beta as mentioned above and the relationship is as follows 

change_in_skew = const*atmvol*(1-beta)*change_in_atmf, 

For a given expiry, change in skew increases as the time to expiry goes down. As a results closer the backbone parameter towards log-normal, greater the change in modeled skew (in terms of normal bps vol, which is market standard in rates space). This also mean a marked blend lower than the "actual" blend will overestimate the skew changes and vice versa. Currently, the 10y tails skew dynamics is over-estimated by SABR. At the current marks, the 5y tails shows good agreement with recent market dynamics. This has implications for delta-hedging, as SABR will miscalculate the delta profiles of long tenor trades, especially ones with high dVega/dRate. And this will mean surprises for the dealers, especially following large market moves (and little change in vols) - the kind of markets we are witnessing recently

Thursday, June 13, 2013

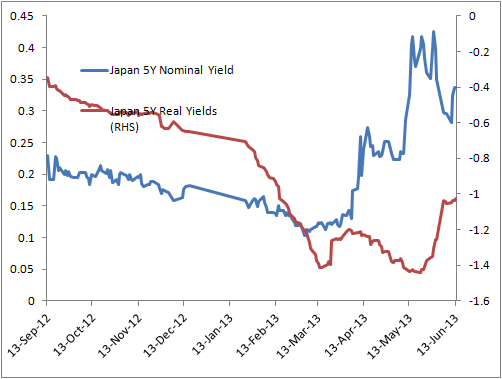
A Tale of Two Sell-Offs

The US real yield sold off with the treasury. In Japan on the other hand, the real yields was actually rallied during the BoJ selloffs, and then sold off back in as the JGBs rallied back


The QE in Japan is perhaps a good measure, but at 200% debt-to-gdp it is if not too little, definitely late... and perhaps too late.

BoJ and Jap government can either cool down the stimulus and reform, and the expectation goes back to the previous level of "nothing really can work for Japan"

Or they can go all in.

If they do go all in, a tail scenario of hyper inflation is not far fetched. On a long term basis Japan high strikes payers can turn out to be a tremendous trade

And if they choose not to go all in, some future governer of BoJ and future PM of Japan will not have the luxary of the choice

Thursday, May 9, 2013

"It Wan't Until The Arab Invented The Zero..."

"... that the liquidity trap became a possibility" 

Whether we are in a liquidity trap or not, after the initial inflation fears in early 2009, right after the concerted central banks moves in late 2008 to contain the Lehman crisis, the inflation expectation has remained largely benign. And the demand for hedging inflation tail risk in outright cms caps, popular in 2009, has waned steadily. And, as of now, the convexity trades close to recent historical low, esp for shorter maturities.

As a result, CMS (constant maturity swaps) caps has cheapened relative to payers, as well, in terms of the price of a portfolio of a short ATMF payer vs long CMS single look cap with the same strike, with ATMF cash DV01 times the notional.

This cheapening has resulted in recent historical LOW break-evens for such a portfolio. Here the break-even means the amount (bps) the underlying rates should sell off to make a short payer/long CMS cap portfolio to break-even. And USD rates show a similar trend, emphasizing the global downward repricing since the onset of the Great Recession.

Which is probably correct in pricing the inflation tail risks - given the elusive economic recovery and the super credibility of the central banks on both sides of the Atlantic. 

We have witnessed a repricing of real rate since the crisis in both the economies However, for euro, this situation can be interesting for someone positioning for other possible tail risk events in the monetary union. Given the current scenario, rates perhaps is not the best asset class for positioning for such a situation, but within rates universe, this long convexity package can be attractive. A typical tail events in rates are historically associated with a rally in rates and vol, but given the current levels of rates, it would not be surprising if we have a massive selloff instead, especially in the short end - (along with a steep flattening). Front-loading of risk premium is a case in point, another is the comparattively higher foreign investors share in german bonds compared to local investors, and an extreme third may be even a policy rate hike to prop up euro

Thursday, April 11, 2013

Short End/ Belly Dynamics in 3 Charts

Three graphs that capture the actual/ expected move in the euro short ends and belly in recent past/ future


The 1st one , shows the excess liquidity in the Euro System. From the peak crunch in January end and a very rapid contraction in excess liquidity, the pace of contraction has come down to a much smaller amount (average 4b per week since March ECB meeting). But even at this rate, it will breach the psychologically important 200b mark by early next year, and possibly before than if the pace picks up. This will bring in a proxy monetary tightening, and if we do not have massive improvement in Euro area economy, will force ECB for a rate cut (or other easing), not as a stimulus, just to avoid any tightening. 

The 2nd chart, shows the recent move in the belly in three different ways, GAP OUTS: the 5y swap rate move only due to gap-outs (from last close to open, capturing overnight and pre-market news), TRADING HRS: moves only due to changes during trading hours (capturing news during the trading hours), and the actual 5y swap. Notice the trend in the GAP OUTS line, which clearly shows the underlying trend in the belly since Jan end (perhaps mostly influenced by economic releases pre-hours, esp PMIs) and the directionless nature of the TRADING HRS line (mostly influenced by ECB liquidity announcements and fixings presumably) 

And the last one is the macro reason, shows the retails sales (volume, adjusted for seasonality) since Jan 2002 for Euro Area countries. This chart underscore the reason for more stimulus from ECB, on top of easing to avoid proxy tightening mentioned above. A rate cut, while in itself will achieve little direct impact through credit channel, will nonetheless show strong commitment of ECB to keep the liquidity strong "as long as needed", and the only official way EURO can hope for a depreciation to boost exports. Given the severe ongoing deleveraging in domestic sector, along with fiscal tightening, the domestic demand will remain far from upbeat, the best hope is the signalling effect (the best monetary policy can do), and the feedback impact through export, benifiting from a recovery in global growth. Apart from France and Finland, none of the EU countries - be it the core, or the peripheries or the program countries, has returned back to the pre-crisis peak in domestic demand. At best they are flat, and mostly far more discouraging than that. Even France and Finland are flattening out lately. On the core, Netherland down 10%, on the peripheries, Spain down -25%, and on the program countries, even Ireland, which is perhaps the best example among them, is down 11% from pre-crisis value

Thursday, April 4, 2013

ECB Worries About Fiscal Policy 3 Times More Than Monetary Policy!

Very unlike the central bank it was before the crisis, or even much after it.

As expected, ECB finally accepted that all was not really well with euro area economy and a recovery in the 2nd half is far from certain. And without any "precommitment", accepted as much as there will be some visible actions in "next few weeks" as they have had "extended" discussion over rate cuts. Which is markedly dovish compared to March meeting.

It was also obvious ECB, without any major helps from governments and bound within the mandate, is at a risk of running out of tools. Mr Draghi summarized today's statements on monetary policy in 35 words, and then went on to spent 100 words to summarize what he expects in terms of fiscal policies Expect the belly grinding higher in a rally in expectation of a rate cut. And long end poised for a come-back selloffs on any good sort of good news, from euro zone or the outside world