Three graphs that capture the actual/ expected move in the euro short ends and belly in recent past/ future
The 1st one , shows the excess liquidity in the Euro System. From the peak crunch in January end and a very rapid contraction in excess liquidity, the pace of contraction has come down to a much smaller amount (average 4b per week since March ECB meeting). But even at this rate, it will breach the psychologically important 200b mark by early next year, and possibly before than if the pace picks up. This will bring in a proxy monetary tightening, and if we do not have massive improvement in Euro area economy, will force ECB for a rate cut (or other easing), not as a stimulus, just to avoid any tightening.
The 1st one , shows the excess liquidity in the Euro System. From the peak crunch in January end and a very rapid contraction in excess liquidity, the pace of contraction has come down to a much smaller amount (average 4b per week since March ECB meeting). But even at this rate, it will breach the psychologically important 200b mark by early next year, and possibly before than if the pace picks up. This will bring in a proxy monetary tightening, and if we do not have massive improvement in Euro area economy, will force ECB for a rate cut (or other easing), not as a stimulus, just to avoid any tightening.
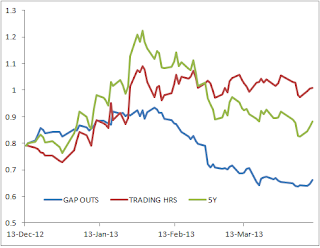
The 2nd chart, shows the recent move in the belly in three different ways, GAP OUTS: the 5y swap rate move only due to gap-outs (from last close to open, capturing overnight and pre-market news), TRADING HRS: moves only due to changes during trading hours (capturing news during the trading hours), and the actual 5y swap. Notice the trend in the GAP OUTS line, which clearly shows the underlying trend in the belly since Jan end (perhaps mostly influenced by economic releases pre-hours, esp PMIs) and the directionless nature of the TRADING HRS line (mostly influenced by ECB liquidity announcements and fixings presumably)
And the last one is the macro reason, shows the retails sales (volume, adjusted for seasonality) since Jan 2002 for Euro Area countries. This chart underscore the reason for more stimulus from ECB, on top of easing to avoid proxy tightening mentioned above. A rate cut, while in itself will achieve little direct impact through credit channel, will nonetheless show strong commitment of ECB to keep the liquidity strong "as long as needed", and the only official way EURO can hope for a depreciation to boost exports. Given the severe ongoing deleveraging in domestic sector, along with fiscal tightening, the domestic demand will remain far from upbeat, the best hope is the signalling effect (the best monetary policy can do), and the feedback impact through export, benifiting from a recovery in global growth. Apart from France and Finland, none of the EU countries - be it the core, or the peripheries or the program countries, has returned back to the pre-crisis peak in domestic demand. At best they are flat, and mostly far more discouraging than that. Even France and Finland are flattening out lately. On the core, Netherland down 10%, on the peripheries, Spain down -25%, and on the program countries, even Ireland, which is perhaps the best example among them, is down 11% from pre-crisis value


No comments:
Post a Comment